Saturday, February 25, 2017

"One Fish, Two Fish, Red Fish, Blue Fish" Sorting with Google Slides

With the birthday of Dr. Seuss coming up this week (March 2nd) millions of children will be doing activities related to many of his wonderful books. I have always been a fan of Dr. Seuss' work, having read his books more times than I can remember to my kids.

At one of our school they are highlighting one book each day, with projects tied to the book of the day. In preparation for the week, they asked if I could help out with some technology ideas for some of the activities.

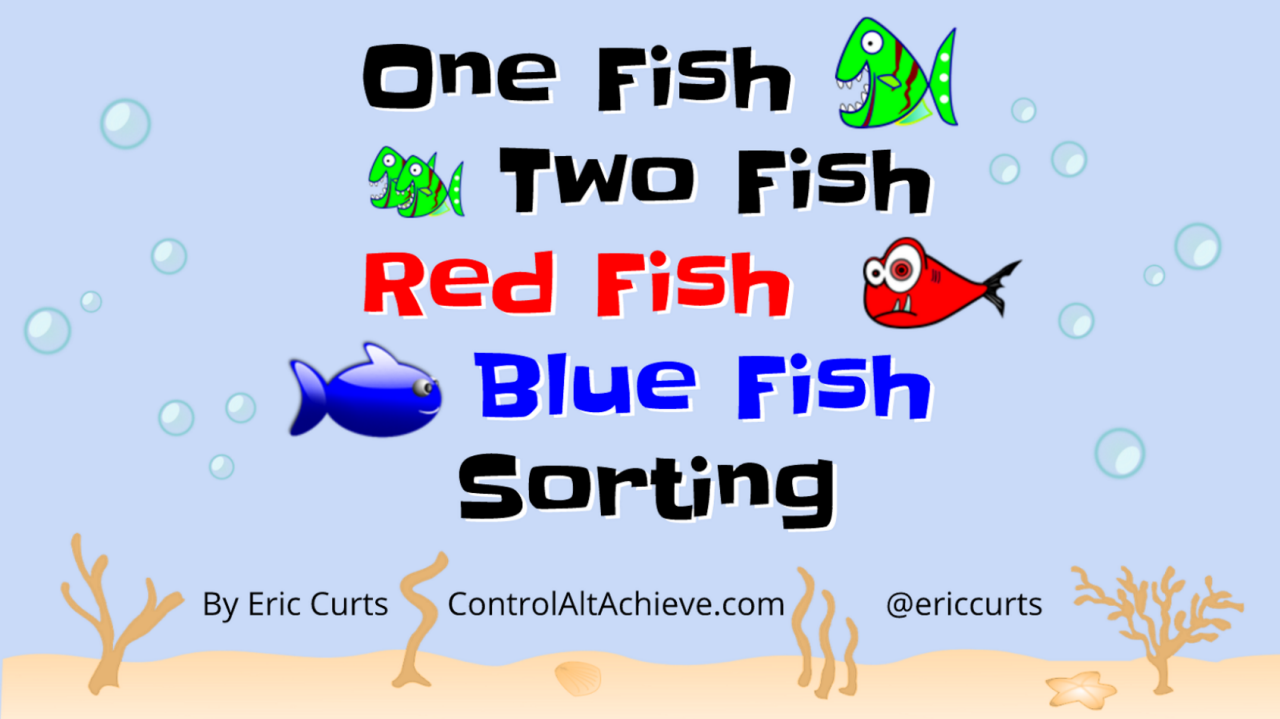
I was more than happy to connect my love of Dr. Seuss with technology! For the first day this week the book will be "One Fish, Two Fish, Red Fish, Blue Fish." As we thought about the book, we decided a fun related activity may be using a graphic organizer to sort fish based on their characteristics.

To do this we created a Google Slides template. Some of the slides have students dragging fish into Venn Diagram bubbles based on characteristics, and other slides have the fish already in the bubbles so that the students need to figure out what rules have been used.

See below to get your own copy of the "One Fish Two Fish Red Fish Blue Fish Sorting Template", as well as detailed directions on how it can be used.

Sunday, February 19, 2017

Have Students Create Educational "Motivational Posters" with Google Drawings

We are all familiar with motivational posters. They typically have a black background, one large image at the top, then a word or short phrase in large type below it, and finally a short inspirational sentence at the bottom. These motivational posters have been around for decades, and most likely can still be found in the classrooms, libraries, and offices of your schools.

However, beyond just providing some encouragement to students, motivational posters can actually be used as a fun and educational activity. With some simple technology tools, students can create and share their own motivational posters. These creations can be used to show students learning and understanding of any concept being taught in your subject.

See below for some free templates, directions on how students can create the posters, and ideas for how this activity can be used in your class.

Monday, February 13, 2017

My OETC 2017 Sessions

I am excited and honored to once again present at the Ohio Educational Technology Conference (OETC 2017) in Columbus this February 14th through 16th.

I always look forward to this opportunity to see old friends, make new friends, share some ideas, and learn so many new things from others.

Below is a list of sessions I will be presenting at OETC 2017, along with any associated resources. Please feel free to join me for any of these sessions. I look forward to sharing, learning, and chatting with you!

Sunday, February 12, 2017

Spreadsheet Activities for all Subjects

I had the opportunity to present the following webinar recently:

Holy Sheets! Google Sheets Activities for all Subjects
Google Sheets is not just a tool for crunching numbers. It is a powerful tool for learning, inquiry, exploration, and inspiration in any subject area. In this session we take a look at several practical activities for a wide range of content areas including random writing prompts, flash cards, educational games, student-created learning databases, art and creativity, conditional formatting feedback for students, task lists, and of course analyzing data to draw conclusions and make predictions.

In the training I covered lots of creative ways that Google Sheets can be used for student activities including:

📊 Analyzing Data
💡 Learning Databases
🕹️ Educational Games and Activities
🎲 Random Generator Activities
🖼️ Art Activities
✔️ Tasks Checklists
💬 Conditional Formatting Feedback
💻 Activities from Google's Applied Digital Skills

See below to view the full 1-hour recorded webinar, and access to all of the links, templates, and resources covered in the session.

Friday, February 10, 2017

Fabulous EdTech Blogs to Follow

One of my main sources for new educational technology ideas, tools, and resources is reading blogs. Every day is an adventure to see what new technology integration ideas I can learn, explore, and share with others.

Over the years I have collected a large list of EdTech blogs that I read. To make this process manageable, I use Feedly to pull all of the blog posts together so I can visit one single location to see everything that is new. For more details on how to use Feedly, see my earlier post on the topic.

In case you are looking for some new EdTech blogs to follow, below is a list of 75 of my favorites. Two quick notes of clarification first though:

First, the blogs are simply listed in alphabetical order. Some of the blogs are very well known, while others have a smaller following. Some generate new posts every day, while others only add new content a few times per month. The one shared characteristic of all of these blogs is I have found them to be valuable and have learned from each one. To keep things simple, the list is alphabetized.

Second, the list is far from complete. I am sure I am missing many, many excellent EdTech blogs … and I want you to let me know what I am missing! As much I hope to expand your PLN, I am also hoping to learn about many other blogs. Please use the comments section below or message me on social media to recommend any valuable educational technology blogs that you are aware of.

Tuesday, February 7, 2017

Have Students Build Learning Databases with Google Sheets

Google Sheets is an amazingly flexible tool, allowing you to randomly generate writing prompts, create pixel art, and discover mathematical properties. Another great use for Google Sheets is for students to create interactive learning databases.

"What exactly is that?" you ask.

Here's the idea. While in your class, students have to process a large amount of data. Maybe it is:
  • Characters in the novel they are reading
  • Animals in their elementary science class
  • Careers they are exploring in high school
  • Countries of the world they are studying
  • Artists and the works they created
  • Properties of geometric shapes
Using Google Sheets your students can
  • Collect important details as they are learning, and build their own database of information, either individually or collaboratively. 
  • Once complete, students can use the sorting and filtering features in Sheets to answer questions about the content they have been learning.
See below for several examples from a variety of subject areas, as well as directions on how to build these spreadsheet learning databases and use the sorting and filtering tools.

Saturday, February 4, 2017

Pixel Art Activities for any Subject with Google Sheets

Growing up with video games in the 70's and 80's, I was well aware of pixels. When video games first started out, the screen resolution was so low that all your game characters and items were made of big blocky squares called pixels. With some imagination we could see a jumping plumber or a flying spaceship in those 8x8 or 16x16 grids of colored dots.

Today video games are so hyper-realistic that you can't tell if you are watching a real-life video or a computer simulation. However, everything old is new again, so there has been a resurgence of love for retro-games and their nostalgic pixelated style.

And so we have "Pixel Art" which is making images out of a small grid with limited number of colors. As with any creative activity, pixel art can have many applications for education. Lots of educators have created pixel art templates and activities including Alice Keeler here and here and here and Patrick Johnson here.

In this blog post you can get a copy of a free 26-color pixel art template I have created for Google Sheets which includes several built-in activities. We will also look at directions for how to use and modify the template as needed for a variety of activities.

Thursday, February 2, 2017

Creating Fractions in Google Slides and Drawings

As a previous math teacher I always have a soft spot for the challenges faced when trying to use technology in math. A common pain point involves trying to put fractions or mixed numbers into a Google Doc or Slideshow or such.

Adding normal text, numbers, and symbols is a snap. However, things become tricky when attempting to properly represent a numerator over a denominator in a program that only wants you to type from left to right.

Thankfully for Google Docs and Google Forms you can use an add-on such as g(Math) which will let you create a fraction or mixed number, and then turn that into an image that you can add to the Doc or Form. Get g(Math) for Docs or g(Math) for Forms.

Unfortunately, Google Slides and Drawings do not support add-ons yet (please Google!). So if you want to add a fraction or mixed number to a slideshow presentation or a Drawing diagram, you will need to get a little creative.

One option is to use tables, with a little twist. See below for directions on how to do this, as well as a free template with lots of pre-made fractions and mixed numbers that you can copy, paste, and edit as needed.