

It can be used for many tasks such as:
- Analyzing student data to identify at-risk students
- Tracking student behavior
- Managing inventory
- Collecting attendance from a PD session and generating certificates
- Providing conditional formatting feedback in learning activities
- Building a learning database for students to draw conclusions from
- Making pixel art
- Creating interactive learning games and activities
- And much more!
To help with, below you will find a 20-minute crash course video on Google Sheets where we cover topics including view options, freezing rows and columns, sorting data, filtering data, formulas, charts and graphs, sparklines, conditional formatting, and even pivot tables.
You will also find templates you can make copies of to follow along and try out each of the features demonstrated. I am excited to see what you do with these skills, and welcome any questions you have as you learn!
▶️ Tutorial Video (20 minutes)
View on YouTube at: https://www.youtube.com/watch?v=5VoOP6sWVlw
🧰 General Resources
- Session Slideshow - "Analyzing Student Data With Google Sheets" - Google Slides link
- Session Resource Doc - "Analyzing Student Data With Google Sheets" - Google Docs link
- More Google Sheets resources - "Spreadsheet Activities for all Subjects" - Resource Doc - Slideshow - Blog Post - YouTube Video
📄 Templates
Make copies of these templates if you want to follow along with the video and try out the examples that are demonstrated.
- Student Data Template #1 - Google Sheets link
- Student Data Template #2 - Google Sheets link
🔎 View Options
There are several helpful tools to make it easier to see our data, especially when working with a large amount of data, or when trying to navigate around our Sheet.
- Freezing rows and columns - Google help page
- Resizing rows and columns
- Zoom tool

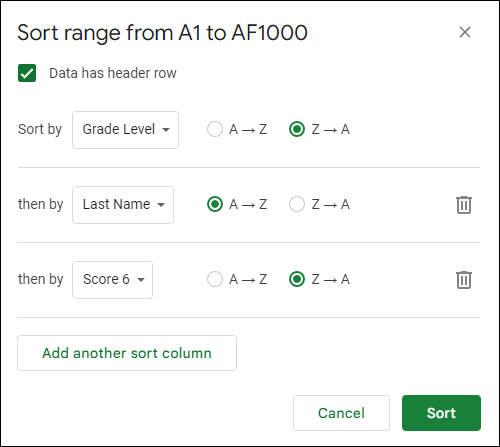
⬆️ Sorting Data
A common way to analyze your data is to use sorting. With sorting you can rearrange your rows of data by number or alphabetically.
- Sorting by one column - Google help page
- Sorting by multiple columns - Google help page
- Splitting text to columns - Google help page
🔻 Filtering Data
Another helpful tool when working with your data in a spreadsheet is filtering. Filtering is an option that allows you to hide the rows you don't want to see, and only display the rows that meet your criteria. This can be very helpful when you have a lot of data to analyze.
- Filtering by one column - Google help page
- Filtering by multiple columns - Google help page

✖️ Formulas
Although spreadsheets are a great way to collect, sort, and organize all your data, one of the most powerful benefits of a spreadsheet is the ability to add formulas that can do calculations based off of your data.
- Using formulas and functions - Google help page
- Google Sheets function list - Google help page
- AVERAGE function - Google help page

📊 Charts and Graphs
Another great way to understand your student data is to represent it visually with a chart. This can be helpful as we might see a trend or spike or valley more easily if we are looking at a visual representation rather than just the numbers.
- Adding and editing charts - Google help page
- Types of charts - Google help page
- Moving a chart to its own sheet
- Inserting charts into other files

📈 Sparklines
Google Sheets has another option for visually displaying your data called sparklines. Sparklines are different from charts in that each sparkline graph fits entirely inside of a single cell.
- Creating sparklines - Google help page

🟩 Conditional Formatting
Conditional Formatting is a tool in Google Sheets that will format cells by changing the color or making the text bold or such, all based on the values of the cells and the rules you set up. For example with conditional formatting we can see at a glance any student grades that fall below a certain value.
- Adding conditional formatting - Google help page
- Conditional formatting rules
- Using color gradients

🔀 Pivot Tables
A Pivot Table is a special tool in Google Sheets that creates a new tab where a large amount of data can be grouped and subtotaled into a simple easy-to-understand table.
- Creating a pivot table - Google help page
- Editing rows, columns, values, and filters
- Customizing a pivot table - Google help page

🏁 Conclusion
Hopefully this 20-minute video gave you a helpful introduction to the basics of Google Sheets. Certainly this just scratches the surface of what you can do with spreadsheets, so feel free to reach out with questions you have.
If you would like to explore spreadsheets more, be sure to check out a 1-hour video I did on creative learning activities you can do with your students using Google Sheets and many of the features we covered. You can access that video and all its resources below:
- "Spreadsheet Activities for all Subjects" - Resource Doc - Slideshow - Blog Post - YouTube Video
Post by Eric Curts
📮 Join the "Control Alt achieve" email discussion group
📰 Sign up for my email newsletter
🐦 Connect with me on Twitter
▶️ Subscribe to my YouTube channel
📧 Reach out through email - ericcurts@gmail.com
📗 Check out my "Control Alt Achieve" book
🏫 Bring me to your school, organization, or conference with over 60 PD sessions to choose from
No comments:
Post a Comment