

With Valentine's Day coming up, I was asked if I had a similar version of the activity using Valentine Conversation Heart candies. That sounded like a terrific idea, so I made a new version of the project that uses the seasonal heart candies with little messages on them.
Very much like the earlier Skittles activity, this "Hearts and Charts" Google Sheets project allows students to practice skills including:

Get your own copy of the "Hearts and Charts" template using the link below.


🤔 Estimating🖐 Counting⚖️ Comparing➕ Adding➗ Dividing📊 And Graphing
And the Sheet is self-checking, so it provides feedback to the students as they work through each problem, letting them know if that got it correct or not.
📄 Template
Get your own copy of the "Hearts and Charts" template using the link below.
- "Hearts and Charts" template - Google Sheets link
- You can also access this template at any time using the shortened link: bit.ly/hearts-sheet
After you get your own copy of the template, feel free to use it with your students however you need. For example, you could push out copies to your students through Google Classroom so each student can have their own copy and do the activities.
✅ Directions Tab
The first tab on the Sheet is the "Directions" tab. Here you will find some basic instructions for this project. These include:
- Get a box of candy conversation hearts (but don't open it yet!)
- Click on the "Activity" tab below.
- Follow the directions on the "Activity" tab to do the activities.
- Any box that is filled in with light yellow is a box where you will enter your answers.
- Most boxes will check your answer and tell you if it is correct. If the answer cell turns green, then you got the correct answer! If the answer cell turns red, that is not correct. Try again!
- Note: Your box of candy hearts may not have all of the colors listed. You can enter a "0" (zero) for colors you do not have.

⚡ Activity Tab
The next tab is the "Activity" tab. Here is where the students will do all of the activities for the project.
- As they work down the page, there will be directions at each step to follow.
- Anytime they need to enter their answers, there will be boxes that are shaded light yellow.
- As they enter their answers, they will get immediate feedback on if the answer is correct or not by the box turning green or red.
Let's take a look at each activity.
🤔 Estimate your Hearts
First the student will estimate how many hearts they think are in their box, and also predict which color they think will have the most.

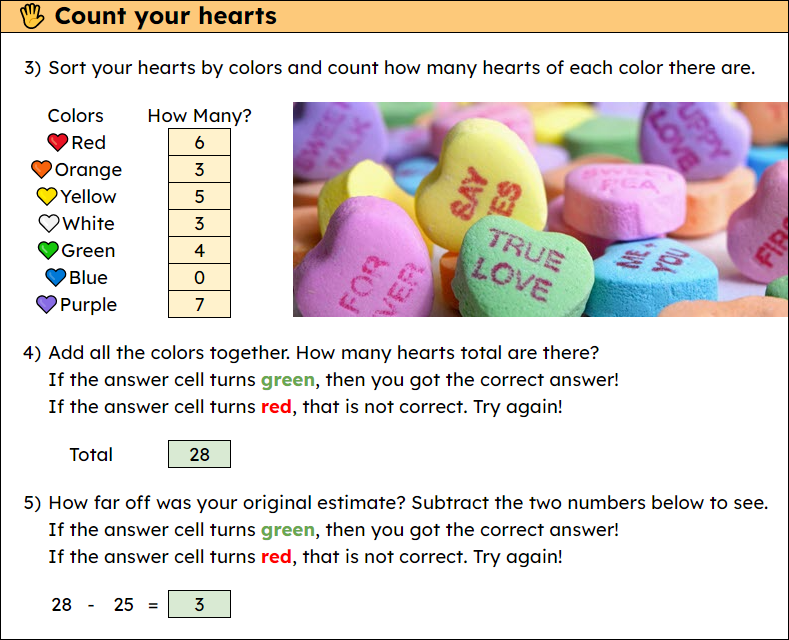
🖐 Count your Hearts
In this section the student will:
- Sort their hearts by colors and count how many hearts of each color there are.
- Add all the colors together and see how many hearts total are there.
- Determine how far off their original estimate was by finding the difference between their estimate and the actual number.
⚖️ Compare your Hearts
In this next section the students will compare the amounts of the different colors of their hearts. Using a drop down menu for each problem, they will choose less than "<" or greater than ">" or equal to "=".

➕ Add your Hearts
In this next section the students will practice addition by adding together hearts of different colors. Again if they get the wrong answer, the box will turn red to let them know to try again.

➗ Divide your Hearts
Next the students will practice division by splitting up candy hearts into groups. In each problem they will divide the hearts into piles of 2, 3, 4, or 5, and then they will also see how many are left over to determine the remainder.

📊 Graph your Hearts
For the final math activity, the students will create a bar graph of their hearts.
- For each color, the student will type the letter "h" into the boxes in the graph to show how many hearts there are of that color.
- The boxes will turn the color of that heart to create a bar graph showing the amounts of each color.
- When done, the student can check their work by clicking on the tab at the bottom titled "Chart" to see an automatically generated bar graph to compare with their graph.

😋 Enjoy your Hearts!
And of course when all done with these math activities, the students can enjoy their candy hearts!
🏁 Conclusion
And that's it! Hopefully this activity will provide an engaging yet educational experience for your students.
If you are looking for more Google Sheets activities, be sure to check out some of the other templates and resources I have created:
- Spreadsheet Activities for all Subjects - Resource Document - Webinar Video
- Skittles and Sheets Math Activities - Blog post - Video - Google Sheets template
- Google Sheets Emoji Math - Addition and Subtraction - Blog post - Google Sheets template
- Self-Checking Translation Quiz in Google Sheets - Blog post - Google Sheets template
- Pixel Art with Google Sheets - Blog post - Google Sheets template
And if you are using this template for a Valentine-themed activity, be sure to check out some of my other Googley Valentine activities:
- Valentine Emoji Rebus Stories with Docs - Google Docs template
- Valentine Magnetic Poetry with Google Drawings - Google Drawings template - Blog post
- Valentine Cards with Google Drawings - Horizontal template - Vertical template - Blog post
Post by Eric Curts
📮 Join the "Control Alt achieve" email discussion group
📰 Sign up for my email newsletter
🐦 Connect with me on Twitter
▶️ Subscribe to my YouTube channel
📧 Reach out through email - ericcurts@gmail.com
📗 Check out my "Control Alt Achieve" book
🏫 Bring me to your school, organization, or conference with over 60 PD sessions to choose from
No comments:
Post a Comment