
Thankfully there are lots of excellent tools out there for creating timelines. Some good recommendations include:
- The timeline template from Flippity - www.flippity.net/Timeline.htm
- The "diagram" tool in Google Slides and Drawings which has a timeline template
- Timeline JS from Knight Lab - timeline.knightlab.com/
- The timeline template from Sutori - www.sutori.com/en/blog/timeline-template
- And many more!
With this new feature it is super easy for students to create and share interactive timelines right in Google Sheets that include titles, descriptions, dates, links, colors, groups and more.
See below for a tutorial video on how to use this new timeline tool, as well as written directions. As always, I would love to see what your students create, and learn from you with new ideas on how this could be used.
Note: The timeline tool is available for anyone with a school account (or work account) but not for personal accounts. This is a new feature, so it is still rolling out for some schools. According to Google, the rollout schedule is:
- Rapid Release domains: Gradual rollout (up to 15 days for feature visibility) starting on November 2, 2022
- Scheduled Release domains: Gradual rollout (up to 15 days for feature visibility) starting on November 16, 2022
▶️ Tutorial Video (14 minutes)
Or watch on YouTube at: https://www.youtube.com/watch?v=PqdjTMit4tU
📄 Optional - Timeline Template
In this blog post we are going to look at creating a timeline from scratch using the new Google Sheets timeline tool. However I have also made a template that can help save time, or make things a little easier for younger students.
The template has all of the needed columns already created and formatted, and the timeline tab set up. You can simply enter your titles and dates and descriptions, and the timeline will automatically be generated.
If you would like a copy of the template, use the link below.
If you would like a copy of the template, use the link below.
- Timeline Template - Google Sheets link

For the rest of this blog post we will not be using the template, but will be creating everything from a blank spreadsheet so you can clearly see all the steps that go into this.
🎂 Completed Examples
Probably the best place to begin is the end. Let's take a look at what a completed timeline will look like. If this were a cooking show this would be the part where we take the fully baked cake out of the oven to show the final result.
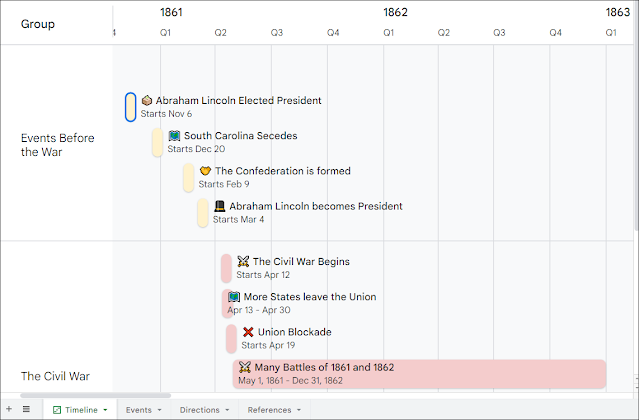
For my examples I have a timeline about the Civil War (with credit to ducksters.com for the event data) and a timeline comparing Edison and Tesla (with credit to softschools.com and transportationevolved.com for the event data).
Give a click on the links below to get your own copies of the sample completed timelines.
- Civil War Timeline example - Google Sheets link
- Edison Vs Tesla example - Google Sheets link
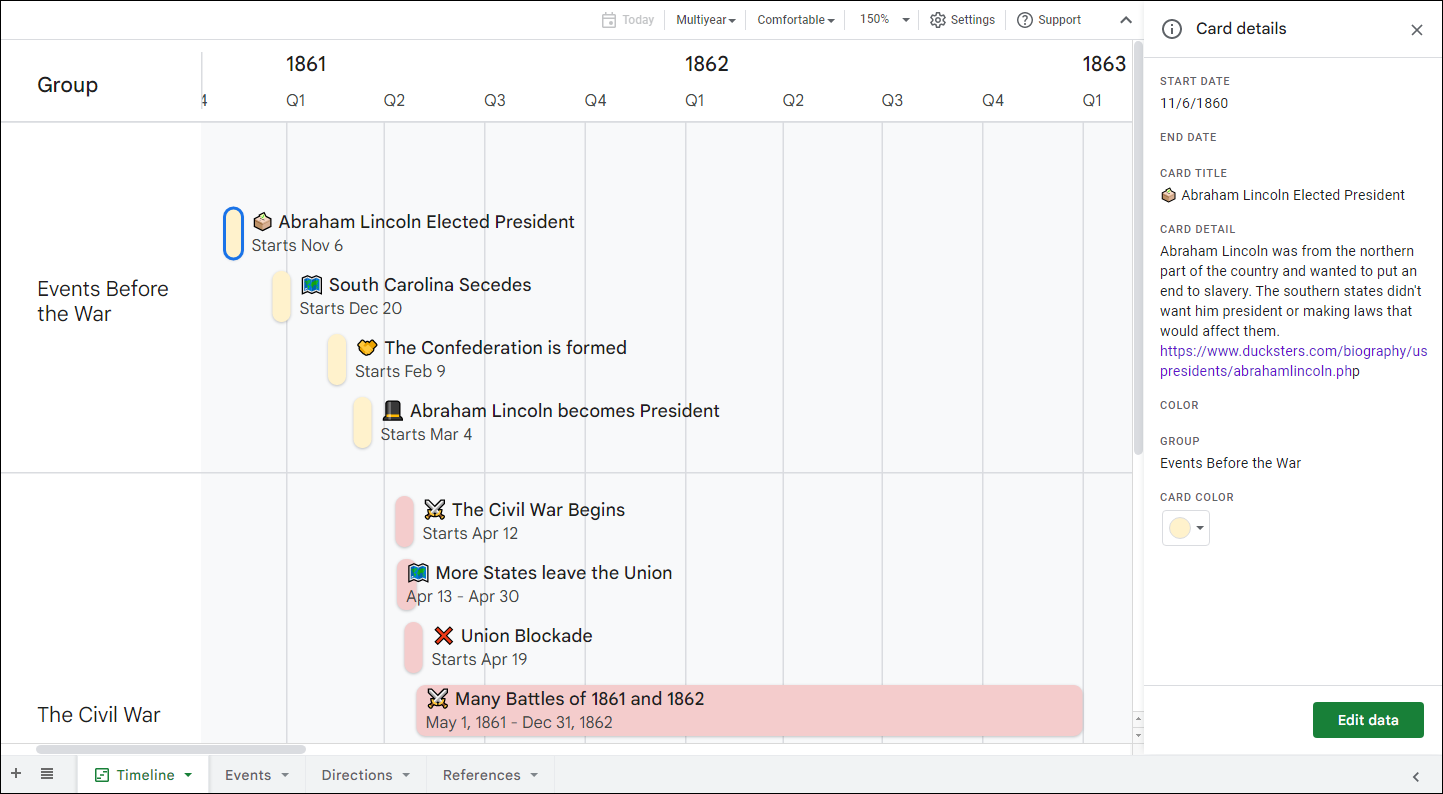
Once you get your copy, you will notice there is a tab titled "Events" where the raw data was entered for all of the events that are to be displayed on the timeline.

And there is a tab titled "Timeline" where we will see the interactive generated timeline.
So that's what a finished timeline in Google Sheets will look like. Let's now take a look at how to build one from scratch.
📋 Entering Timeline Data
To create a timeline from scratch in Google Sheets we will first need to create a blank Sheet.
- Once we have that, we will now want to type in some headers in the first row.
- The timeline tool requires you to have certain headers for it to work.
- Some of these headers are required and some are optional.

Start Date
- So for the "Start Date" we will enter the date the event started on.
- You will need to make sure this is formatted as a date in the Sheet.
- You should be ok just by entering this in standard date format.
- If not you can always select the column and then click "Format" then "Number" then "Date" to set the formatting.
- If you do not have an exact date, but maybe have just the year, you still need to enter this as a full date value. So as an example for "1870" you could enter "1/1/1870".
- Again, this is a required column.

- Next for the "End Date" we will enter the date the event ends on.
- Just like the "Start Date", this column needs to be in date format.
- However, the "End Date" is optional.
- If you have an event that happened on one particular day, or if it does not have a specific end date, you can just leave the "End Date" blank.
- The timeline will show this with a short bar on the start date.
- Another option if you do not have an end date is to put in a date that goes all the way up to the next event on the timeline.
- This will create a solid bar from the start of the event to the beginning of the next event.
- However if you do have an actual end date, then you can enter that date and the event will show as a solid bar from the start date to that specific end date.

Card Title
- Next for the "Card Title" this will be a short text blurb to give the title of the event.
- This title does need to be plain text, but you can include emojis, which can help bring color and clarity to your timeline.
- The "Card Title" is required for the event to show up on the timeline.

- Next the "Card Detail" is where you can give the full details of the event.
- If you need to write multiple paragraphs, you can add line breaks by pressing Ctrl and Enter (or Command and Enter).
- You can also add web addresses to this column and they will become live clickable links in the timeline.
- Again this column is optional.

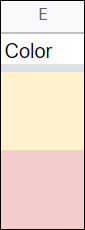
- The "Color" column is optional, but allows you to set a color for the bar that will display for an event.
- You can use this to color-code different categories or types of events or periods of time in your timeline, which can make it easier to understand.
- To fill in a color, simply click in a cell, then click the "Fill color" tool in the top toolbar, which looks like a paint can.
- Next choose the color you want from the provided colors, or choose a "Custom color" if needed.
- The final column is the "Group" column which is optional.
- Here you can add text for a group title.
- Anything with the same group title will be displayed together in the timeline.
- This can be useful to group together events by different time periods, such as with my "Civil War" timeline where I have groups for "Events Before the War" and "The Civil War" and "After the War".
- You can also use groups to compare and contrast different timelines like I did in my "Edison Versus Tesla" timeline where I have one group for "Tesla" and another group for "Edison" and we can see and compare both of their timelines, one above the other.

📊 Making the Timeline
Now that we have entered the data for our events, we can generate the timeline.
Note: If you are using my timeline template, the "Timeline" tab is already created for you.
For those you are making one from scratch, here is how we do it:
Your timeline will now be created!
🧭 Exploring the Timeline
Now that we have our timeline generated, let's see how we can navigate it.
Browse the Events
Adjust the Zoom
Adjust the Timescale
Adjust the Density
View the Details
🔗 Sharing the Timeline
If you want, you can share your timeline for other people to view and explore.
Before you share it though, you may want to move the timeline tab to be the first tab.
To share your timeline you would now share the Sheet in "View only" mode.
- Select the cells that contain your headers and event data.
- You can select just the cells, or you can select the entire columns that hold those cells.
- If you select the entire columns, it will be easier to add more events to the timeline later.
- However you will also see a harmless error message in the timeline settings about "data errors". This is just because the columns include cells that do not have event data, and it is not a problem you need to worry about.
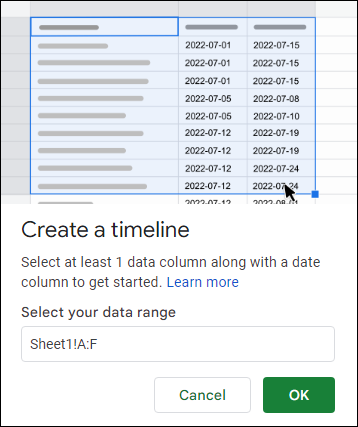
- After you have selected the cells or the columns, click "Insert" in the top menu bar.
- Choose "Timeline" from the drop-down menu.
- This will pop open the "Create a timeline" window. As long as your data range looks correct here, just click "OK".

🧭 Exploring the Timeline
Now that we have our timeline generated, let's see how we can navigate it.
Browse the Events
- The "Timeline" tab will display the timeline from left to right.
- Starting from the left you will see the earliest dates.
- As you move to the right and downward, you will find the later dates.

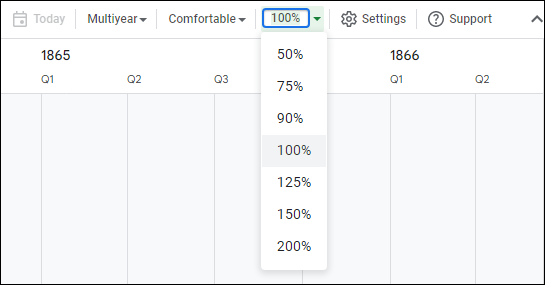
- You can adjust the size of the events by changing the "Zoom" setting from 50% all the way up to 200%.

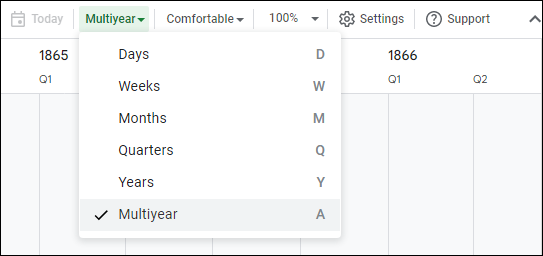
- You can also adjust how many events show on the screen at once by adjusting the timeline "View" option.
- With this you can switch from "Days" to "Weeks" to "Months" to "Quarters" to "Years" and all the way to "Multiyear".

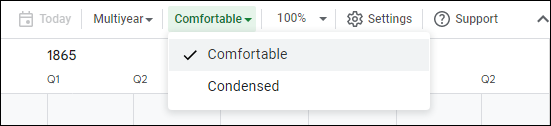
- You can also adjust how much space the events take up by switching between "Comfortable" and "Condensed" in the top menu bar.

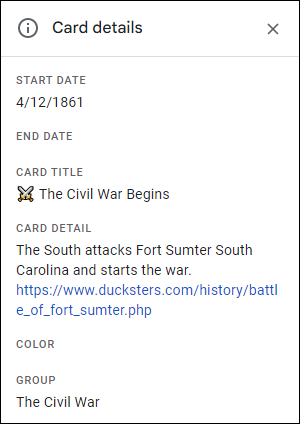
- You can click on any event in the timeline and a panel will open up on the right side of the screen for the "Card details".
- Here you can find more information about this specific timeline event including a description section that can contain more detailed text, as well as clickable hyperlinks out to more information.

🔗 Sharing the Timeline
If you want, you can share your timeline for other people to view and explore.
Before you share it though, you may want to move the timeline tab to be the first tab.
- Your spreadsheet will have a tab called "Sheet 1" (or "Events") that has all of your event data, and a tab called "Timeline 1" (or just "Timeline") which has your interactive timeline.
- Just so people don't get confused, you may want the timeline tab to be the one that shows up first.
- You can simply click on the timeline tab, hold down your mouse button, and then drag the tab to the left so it is the first tab in line.
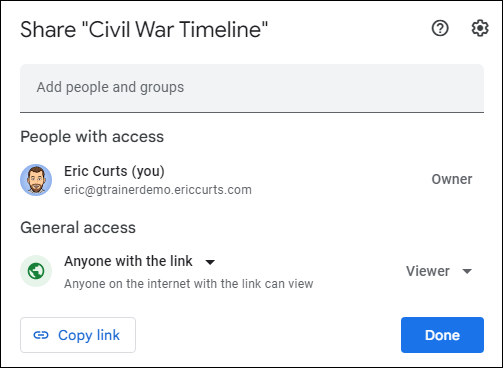
- Click the "Share" button.
- If you want to share with specific people, enter their email addresses at the top of the sharing window and then choose "Viewer" for their rights.
- If you want to share the timeline as a link with anyone, click on "Restricted" in the "General access" section and change that to "Anyone with the link". Again be sure to choose "Viewer" for the right.
- You can now click "Copy link" to get the link that you can share with others to view your timeline.

❌ Limitations
As excited as I am about Google adding this new timeline tool to Sheets, there are certainly some limitations in its current form. Keep in mind, this tool was designed with businesses in mind, such as allowing a team to track their progress on a project. It was not designed with education in mind, but as usual we are good at seeing how we can use any tool for teaching and learning!
So what are some current limitations?
Images
It would be nice to be able to include pictures in the "Card Details". At the moment, no matter how I inserted images into the data tab (and I tried a lot of options) they never would show up on the timeline tab. Pictures would add a lot of educational value to the timeline.
Dates
At the moment the most years you can see at once are 5 years, so it would be great to have an option where you could type in the number of years you want to see, such as 1,000 or more for timelines covering a large historical range.
View Controls
At the moment if you share the timeline with "View Only" rights, the person viewing it does not get all of the viewing controls that you have as the editor. For example, they can change the zoom, but not the density or timescale. Of course they can always make a copy of the Sheet and have full control, but it would be nice for them to have more viewing options, like the way a "Filter View" only changes the view for that person and not everyone else.
Hopefully Google will continue to develop this tool, and perhaps add some of these missing features. If not, we still have a new timeline tool that we did not have before, which provides a good option for students to show their knowledge and understanding.
🏁 Conclusion
And that's it! With this new Google Sheets tool, you and your students can easily create interactive timelines.
If you are able to share, I would love to see examples of what your students make. Also, please let me know any tips or tricks you have to add to this process. I would love to learn from you.
Post by Eric Curts
📮 Join the "Control Alt achieve" email discussion group
📰 Sign up for my email newsletter
🐦 Connect with me on Twitter
▶️ Subscribe to my YouTube channel
📧 Reach out through email - ericcurts@gmail.com
📗 Check out my "Control Alt Achieve" book
🏫 Bring me to your school, organization, or conference with over 60 PD sessions to choose from
No comments:
Post a Comment