

Over the years I have shared several technology activities for celebrating Pi Day in separate posts. This year I have pulled all those together in one place including:
📈 Discovering Pi with Google Sheets
✍️ Create "Pi Poems" with Google Sheets
🏙️ Graph a Pi-Line Skyline with Google Sheets
See below for this great collection of technology activities to help students explore, understand, and create with Pi!
📈 Discovering Pi with Google Sheets
View the original blog post for even more details here: Blog post link
Math is full of patterns and predictable relationships. When students discover these patterns themselves and then draw conclusions they will understand and remember the concepts so much better than if we were to just tell them the information.
One example of this is the concept of pi. It is very easy for us to say "Pi is 3.14" or "Pi is the ratio of the circumference of a circle to the diameter of the same circle" but that is just giving the students information, not helping them discover and truly understand what pi means.
One way to do this is an activity that uses Google Sheets and allows the students to measure real life circular objects, examine some calculations, look for patterns, and discover what pi is and what it means.
Spreadsheet Template
The spreadsheet to be used for this activity can be found at the link below. Simply click the link to get your own editable copy of the spreadsheet.
- Discovering Pi activity - Google Sheets link
Activity Directions
Below are the steps for this activity:
- Each student will need a circular object, such as a can, lid, frisbee, plate, or such. For best results the items should be a variety of sizes.
- Students will also need a tape measure (one that can easily wrap around the circular object).
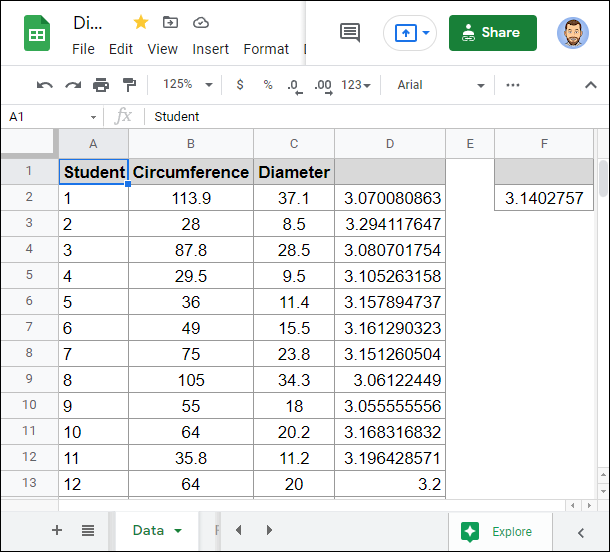
- First each student should measure the distance around their circular object.
- Next each student should measure the distance across their circular object, being careful to go directly through the middle of the circle.
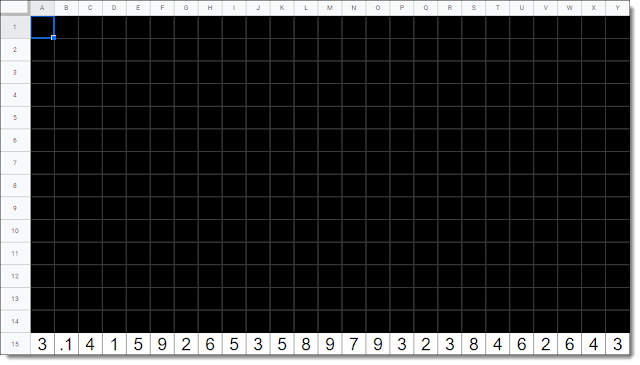
- The students should then record their measurements on the spreadsheet tab titled "Data"
- The spreadsheet will automatically calculate the ratio of the circumference to the diameter for each student. (Note: If you want, you can hide that column or add it later so that you can first discuss with the students what patterns they see.)
- The spreadsheet will also calculate an average of all the ratios from all the students.
- You can also switch over to the tab titled "Chart" where a scatter plot of the data will be generated. This is another good option for the students to look for a relationship between the circumference and diameter.
- The students should examine their ratios, the average ration, and the scatter plot to see if they notice any patterns or relationships.
- Finally switch over to the spreadsheet tab titled "Pi" to compare how close the students' average ratio is to the real value of pi.
By doing this activity students will discover that no matter how big or small a circle is, the distance around the circle is always a little more than three times as much as the distance across. That is, the circumference is always pi times more than the diameter.
✍️ Create "Pi Poems" with Google Sheets
View the original blog post for even more details here: Blog post link
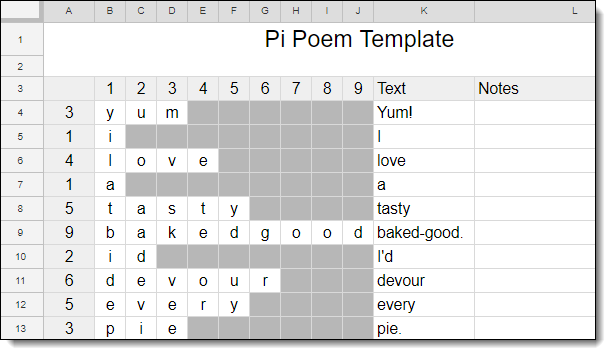
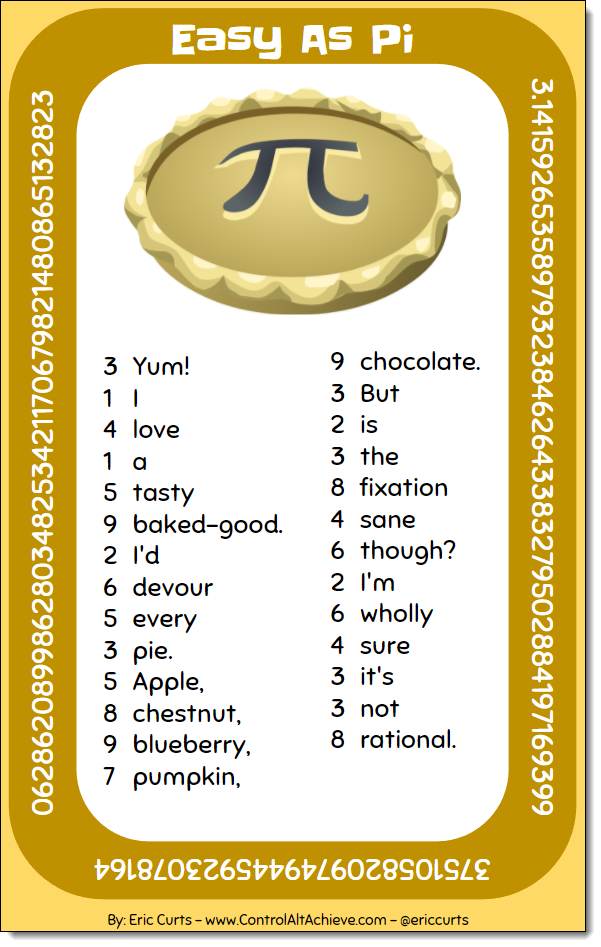
A "Pi Poem" is composed of words where the length of each word is equal to each digit of pi in order. So for example, the beginning of the poem would be made of a 3-letter word, 1-letter word, 4-letter word, 1-letter word, and 5-letter word, for the beginning of pi which starts as 3.1415. Punctuation doesn't count.
Copy the "Pi Poem" Template
To help with this activity, I have created a Google Sheets "Pi Poem" template. The template makes it easier to create your poem with helpful boxes for each letter of each word. To get your own copy of the template simply click the link below.
- "Pi Poem" Template - Google Sheets link
Using the "Pi Poem" Template
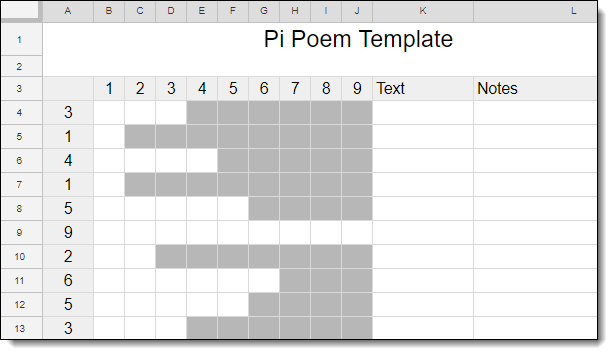
The template is set up as follows:
- The first column lists the digits of pi in order.
- The next set of columns have spaces for you to type in the letters for your words, with cells grayed out to indicate the required length of each word.
- The next column is titled "Text" and is where you can write the final word for each digit, along with any needed capitalization or punctuation.
- The final column is titled "Notes" and can simply be used to jot down ideas, possible words, or other helpful thoughts while working on the poem.
The first 32 digits of pi are numbers from 1 through 9. However, the 33rd digit is a zero. Since you can't have a word that is zero letters long, the template ends at 32 words.
This is probably long enough anyway, as it is quite a challenge to come up with words that fit the required length, while making reasonable sense. Students can create a poem up to 32 words long or can stop shorter if desired.
Note: Punctuation does not count toward the word lengths. Students can add in commas, periods, apostrophes, and such as needed.
🏙️ Graph a Pi-Line Skyline with Google Sheets
View the original blog post for even more details here: Blog post link
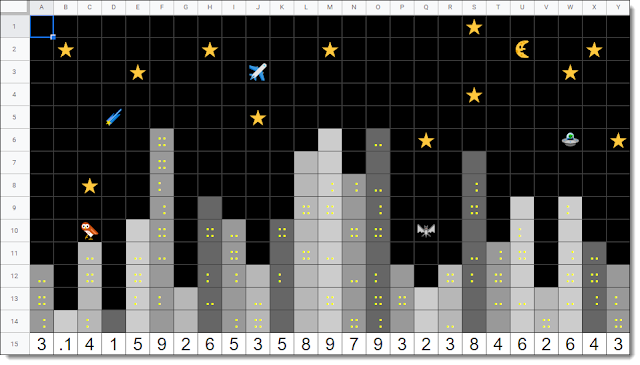
The idea for this activity is for students to create a vertical bar graph, where each bar's height corresponds to each digit of Pi. This gives the impression of a city skyline, which the students then color in to make their own art piece.
Pi-Lines Skylines Template
The fun project can be done with a simple blank Google Sheet, although to provide some structure and resources, I have also created a Pi-Lines Template to help guide the students through the process. You can get your own copy of the template by using the link below:
- Pi-Lines Skylines Template - Google Sheets link
Create Your Bar Graph
The first portion of this project is to create a bar graph for the digits of Pi. Here are the basic steps for a student to use the template:
- First, choose if you would like to make a daytime or nighttime version of the Pi-Line Skyline.
- The "Day" tab has a blue background (for a daytime sky).
- The "Night" tab has a black background (for a nighttime sky).
- The first 25 digits of Pi are listed across the bottom of the "Day" and "Night" tab, with one digit per cell.
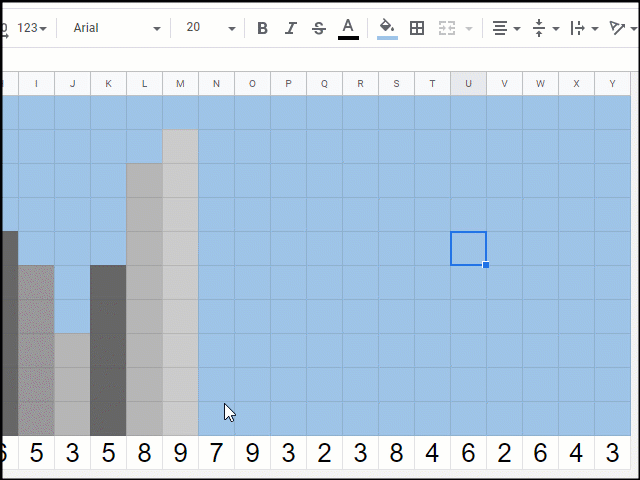
- You now want to create a vertical bar graph, where the height of each bar equals the value of each digit. For example, for the number "7" you would make a bar 7 cells tall.
- To make a bar, click the cell above one of the Pi digits, hold down your mouse button, and then drag up to select the amount of cells you need. With the cells selected you can now color them in.
- To color in the selected cells, click the "Fill Color" button (looks like a paint can) in the top toolbar, and choose any color you would like. Since you are making a city skyline of buildings you can use different colors of gray, or have fun with it and make rainbow buildings!
- Repeat this process to make a bar graph for all of the digits.
Decorate Your Skyline Scene
Now that you have created your bar graph, you will have something that looks like a city skyline. You can now decorate the scene with emojis from the "Day Emojis" tab or the "Night Emojis" tab.
- Click on the "Day Emojis" or "Night Emojis" tab to find the available emojis.
- Click on the emoji you want and then copy it (click "Edit" then "Copy", or Ctrl+C, or right-click and "Copy")
- Now go back to your bar graph tab, click the cell where you want to put the emoji, and then paste it in (click "Edit" then "Paste", or Ctrl-V, or right-click and "Paste").
- Repeat this process to decorate your scene however you want.
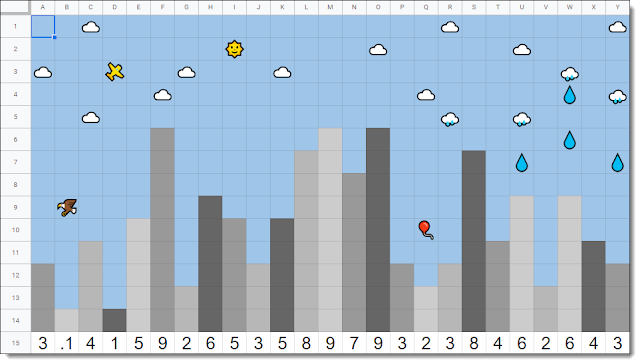
For a fun extra, you can add lighted windows to your buildings by clicking in a cell and typing a colon ":" or a period "." and then using the "Font color" button on the top toolbar to color the text yellow, for example.
No comments:
Post a Comment